The rise in land values
| Land values for broadacre cropping areas within Victoria over the last five years have more than doubled for most regions. Over this time seasonal conditions were favorable resulting in strong yields with good commodity prices. So, has farm income kept pace with land values? |  |
Production – Income & Yield
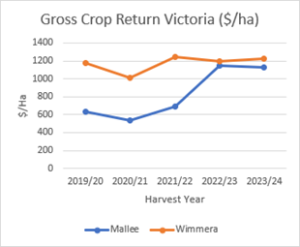
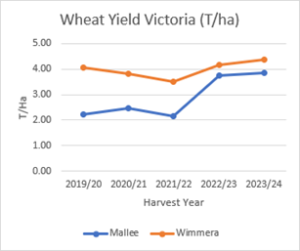
A five-year review of wheat yield and income per hectare for the Wimmera and Mallee from the ORM dataset provides a measure of production for each region. Crop income ($/ha) includes all crops and hay and is before costs. Wheat yield (t/ha) is shown for comparison as the most common crop to all regions.


Figure 1 Gross Crop Return – ORM Dataset Figure 2 Wheat Yield – ORM Dataset
The past two years have been particularly strong for the Mallee with wheat yields and income similar to the Wimmera.
Prior to 2022 the spread between the two regions reflected the difference in seasonal conditions and shows a 1.5t/ha difference in wheat yield and $500/ha difference in crop income.
Income as a percentage of land value
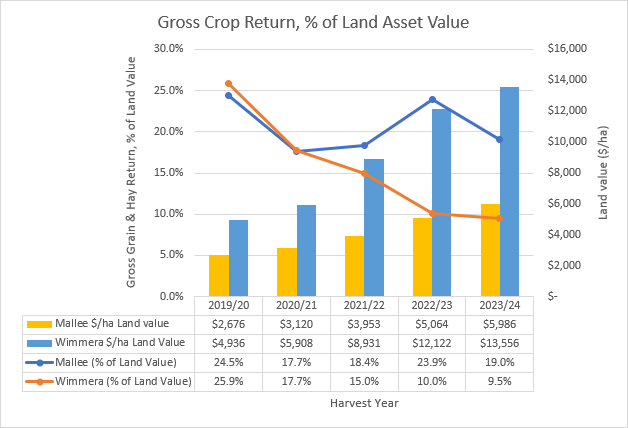
Farm income has historically averaged around 18 – 20% of bare land value and was similar across all broadacre cropping regions in Victoria. This ratio measures the production value of the land and can assist when deciding the land value when purchasing.
So, has this ratio stayed in line with historical trends?
Figure 3 Gross Crop Income as % of Land Value

Mallee:
- Maintains a strong ratio at around 20%
- Income in 2022 and 2023 has increased in line with land values.
Wimmera
- Average income of $1,200 per hectare was maintained across the 5 years.
- Land values more than doubled over the 5 years.
Summary: When is this ratio relevant?
The Wimmera region suggests the income to land values ratio is trending downward. This ratio doesn’t impact the profitability of the existing assets, rather it becomes relevant when individual businesses are assessing their capacity to expand.
If borrowing for a new land purchase and the income to land value ratio has halved, the income generated from the dollars spent to purchase new land is half what it was previously, so serviceability of this new debt becomes the issue. Unless income from the new land can increase to achieve closer to the 20% ratio then it’s likely the business will require good profits from the existing land to cover the interest cost on the new debt.
The positive to come from rising land values is the increased land asset value available as security. This additional security can support new asset purchases while also providing a strong financial buffer if needed to cover trading losses in a low-income year.
If you’d like to check your ratios and financial buffers, ORM can help – contact us here