I was recently discussing with my builder friend how good and useful general building tools have become. Asking what he spends on tools a year, he replied, ‘while they’re expensive, they are worth every cent’. We often assume the same goes for farm machinery.
Many farmers are experiencing some of the best years on record, but along with this increase in income, we are also seeing farm machinery prices continue to increase. At what stage or price does machinery become not ‘worth every cent’?
Perfect Storm
In many areas there has been a perfect storm in recent years of good commodity prices, good seasons, low interest rates and generous tax incentives, that have culminated in tractor sales increasing by nearly 54% from 2019 to 2022.
| According to Agriview data presented at the GRDC Farm Business Updates in March, tractor unit sales increased from circa 10,000 in 2019 to just under 18,000 in 2022. The value of tractor sales reportedly increased even more, from 1.3 billion in 2019 to just over $2 billion in 2022, with the biggest increase in sales value experienced was in the 200-plus horsepower category. |  |
Analysis
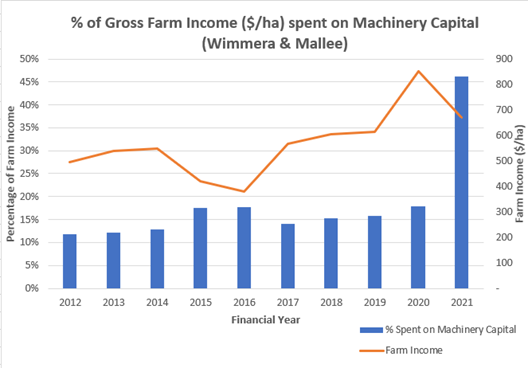
At ORM, we conducted an analysis of businesses throughout the Mallee and Wimmera regions and how much they’ve spent on machinery capital as a percentage of their gross income over a 10-year period.
In the focus group, the effective production area was an average of 3262 hectares, which drove the average income over the 10-year period to $569/ha and the average spend on machinery capital to $106/ha. This resulted in an average percentage of farm income spend on machinery capital of 18.63%. This had grown from 12% in 2012 and peaked at 46% in 2021, a figure distorted by the introduction of the Instant Asset Write Off (IAWO) scheme and the related spike in machinery purchases. If we included 2022 figures, the distortion would be even more pronounced. If we remove the 2021 figures (which in turn removes the effect of the IAWO) and calculate the 9-year average, the percentage of farm income spent on machinery capital was 15%. The operating costs that are related to machinery (fuel and machinery repairs) in 2012 was 12.9% of farm income, while in 2021 it was 9.9%.

Comparing the Machinery Spend
We also looked at the top 25% most profitable businesses over the 10-year period in the Mallee and Wimmera group and compared their machinery spend to the overall group.
 |
We found that the average income of the top 25% was no higher than the whole group ($561/ha), but the increased profitability of the group was driven by better cost control. The top 25% had average expenditure on machinery capital of $93/ha (16.6% of gross farm income), $13/ha less than the whole Wimmera and Mallee average. Interestingly, the top 25% were also able to reduce expenditure on cost areas like fuel, repairs (down 27% on whole group average) and a 62% reduction in hired contracting costs when compared to the entire Mallee and Wimmera group. |
The New Dynamic
The perfect storm of the previous 3 years seems to be clearing, with interest rates rising, inputs costing more and current generous temporary full expensing measures coming to an end. While the government announced in the recently released budget that from 1st July 2023 small businesses will be able to immediately deduct the full cost of eligible assets costing less than $20,000 (including GST), it will be interesting to watch what happens in machinery markets post the changes in tax treatment. And in the longer term, we will be keenly observing if machinery capital expenses return to 10 – 12% of average gross farm income, or if we have entered a new dynamic in machinery expenses? Only time will tell if the investment in machinery over the last 3 years is well and truly ‘worth every cent’.
James Naughton, Graduate Business Analyst
For more information or your own farm analysis contact us on 03 5441 6176 or email us here admin@orm.com.au